Compare Results
Two tools are provided in the Spatial Data Modeller as aids to comparing results obtained from the different analytical methods. They are:
How to use the Compare Results
tool ![]()
![]()
Comparison of Ranks
The ranks of values are compared rather than the raw values because the results from different methods may be scaled over a different range. For example, weights of evidence will typically generate higher probabilities than logistic regression, particularly for the areas predicted to be most favourable. When results are compared relatively, eg. using ranks, the results are very similar. So, for example, in the prediction of mineral favourability, the 5% of are study area predicted to be most favourable by one method is compared with the 5% predicted to be most favourable by the other method rather than the absolute probabilities generated by either method.
Ranks are generated by sorting the data in ascending order and assigns integer values R = 1, 2, ..., n. Spatial Data Modeller defines 20 ranks, or the maximum possible if the data set is too small to generate 20. The area weighting is built in to the equations for the Spearman's Rank Correlation, while an equal area classification is used to rank the data for the Map of Rank Differences.
Area Weighted Spearman's Rank Correlation Coeffiecient
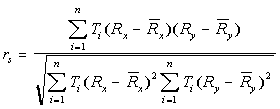
If data in one data set are being compared to data in another data set, the two data sets are combined to create a unique conditions grid so that ranks can be compared for the same areas or "polygons". (If data from two fields in the attribute table of the same data set (grid them) are being compared this step is not necessary.) The data is transformed to ranks. The mean rank is calculated and the area associated with unique condition or polygon determined. An algorithm to calculate the following equation is used to calculate the coefficient:

rs is reported in a table based on a dBase file.
rs varies from 1 (perfect correlation) through 0 (no correlation or independence) to -1 (perfect negative correlation).
Ranks are generated using an equal area classification. The grid themes being compared are reclassified by rank and a unique conditions grid is generated that is the basis of the map of rank differences. For each unique condition, the difference between the source ranks is calculated and appended to the attribute table. It is this difference that is mapped. The map is primarily a visual tool: areas where the input maps match are coloured grey; the greater the first ranked data is than the second, the greater the saturation of blue; and the greater the rank of the second map is than the first, the greater the saturation of red.
| Next | Section Contents | Home |
![]()
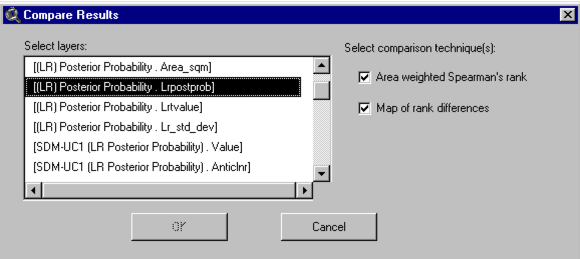
How to use the Compare Results tool

The box labelled 'Select layers:' lists all of the "theme-field" combinations available for comparison. The format for each item is [theme name . field name]. Valid inputs for comparison are all the grid themes in the active view and the numeric fields in any integer grid theme attribute tables. If a grid theme is based on a floating point grid, the field name is specified as 'Value' (although technically there is no field).
 |
 |
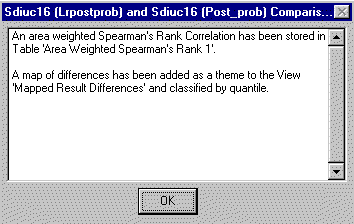
When processing is complete, the location of the table containing the Spearman's rank correlation coefficient and the name of the view containing the map of rank differences is reported:

| Next | Section Contents | Home |
![]()