This text was originally published in the Jornal da Unicamp. Click here to read the original text in portuguese.
Three recent studies on the research systems of nations that do not belong to the group of developed countries provide different pieces of evidence that help us understand why we are the way we are.
The first is a set of data produced by Professor Brito Cruz (Elsevier) titled New Geography of Research; the second is a study on the cartography of open science worldwide and the position of countries in the Global South, developed by Professor Maria Fernanda Beigel from the University of Cuyo (Argentina), titled “Cartographies for an inclusive Open Science”; the third is an article written by Professor Luciano Digiampietri and collaborators titled “Approaching bibliometrics and prosopography.”
Through geographies, cartographies, and prosopographies (in this case, the study of professional trajectories), we discover evidence about where we are and why we are the way we are. And above all, we reflect on the future we are building for Brazilian research (and for other countries with similar income and development levels).
In the New Geography, we see that global scientific production grew at a rate of 5% per year (a.a.) between 2003 and 2023, and the rate of growth in the number of authors occurred even faster: 5% a.a. in high-income countries and 10% a.a. in low- and middle-income countries. We also see that, according to the Scopus database, today low- and middle-income countries already produce more than 50% of the articles and account for more than 50% of the authors.
A word of caution: this count includes China and India, two giants that are likely to grow even larger. Since 2018, China has surpassed the United States in the number of publications and now accounts for over a quarter of the global total (measured by Scopus). India still produces half of what the United States does, but it’s already twice the output of the United Kingdom. Both are large, but their trajectories are quite different, which would require a separate analysis.
Even leaving aside these two countries, when it comes to the growth in the number of article authors, other countries in the middle or lower-middle income range, such as Brazil, Iran, Malaysia, and Pakistan, show high annual growth rates for authors, exceeding those of central countries.
One question the reader may already be asking is about the increase in the number of citations of publications from middle- and low-income countries. According to the data from New Geography, the numbers now rival those of central countries in the highest strata (articles in the top 1% of citations).
For these reasons, the author projects a new geography of research, as scientific production is growing at a faster pace than in developed countries.
It is possible that we are still feeding feelings of inferiority and viewing the global scenario from a third-world perspective. But it is also possible that this new geography is just beginning to emerge, without perceptibly altering the status quo of global research (with the exception of China).
In any case, we’ve had the ticket to participate in the game for a long time. I believe this is true in all areas of knowledge. We produce quality knowledge in growing quantities. We appear less than we produce, and I suspect we use the knowledge we produce far less than we could.
The reasons? Well, they are diverse, as in any complex problem. I discuss some of them below.
In the second study, on the cartography of open science, the author presents data that aligns with the data above. The study addresses the situation of seven themes related to scientific production in countries of the Global South, focusing on open science. I’ll mention just two of them here: the prevalence of the Digital Object Identifier (DOI) as a mechanism for the automatic identification of publications and citations; and multilingualism in scientific publications.
The widespread use of persistent digital object identifiers, among which the DOI is the most well-known and used for articles and journals, influences the automatic search ability for publications and citations, and consequently, the metrics used to measure the performance of researchers, universities, journals, and countries.
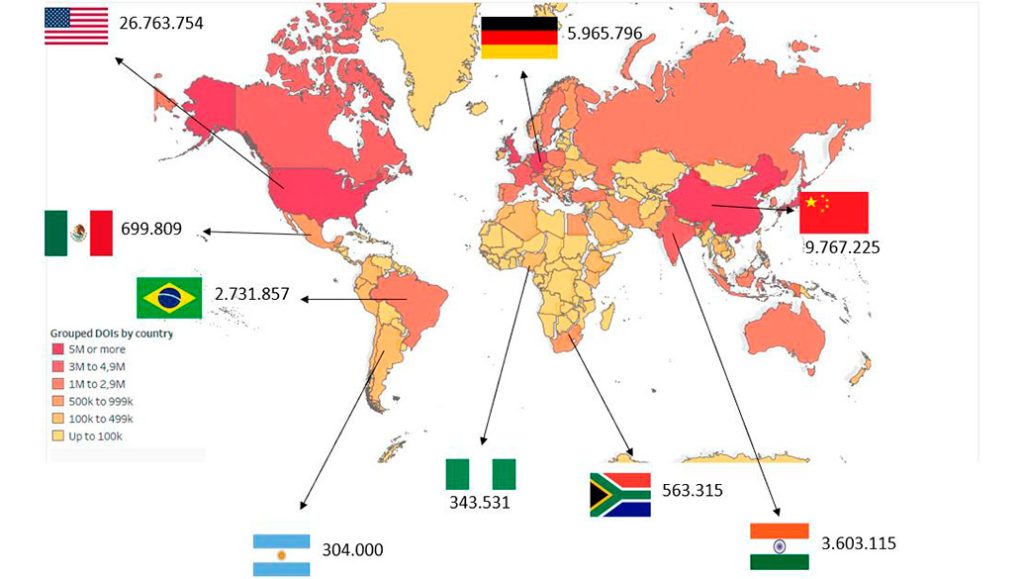
In the work on cartography, the author highlights that the use of DOI in countries of the Global South is much lower compared to those in the Global North. In the Directory of Open Access Journals (DOAJ) platform, 54% of journals published in Latin American countries do not have this identifier. In Brazil, the figure is 48%. The author estimates that higher-income countries with smaller populations have between two to eight times more journals with DOI.
Considering the total number of DOIs (not just open objects), Latin American countries show much lower numbers compared to their publication totals. This likely contributes to their less frequent appearance in global indicators. Without identifiers, almost nothing enters the numerology produced by major scientific publication databases.
Multilingualism is a topic that has been highlighted in various forums, especially those that seek to report the impact of science in languages other than English. I’ve always heard my colleagues say that English is the language of science. And it is, indeed. But should it be the only one? As a general rule, publishing in Portuguese, for example, tends to result in less reach than publishing in English. The point currently gaining prominence in the discussion is that English should not be considered the only relevant language in science.
I could list some factual reasons, more or less obvious, for this. But let’s look at data that helps us understand.
In the study on cartography (Tables 7 and 8), we see the following data:
- Nearly 95% of publications based on the Web of Science are in English; Spanish and Portuguese together account for 0.7%.
- In the Scopus database, this number is slightly different: 85% in English; Portuguese and Spanish together account for almost 1.6%.
- In the OpenAlex database, 73% and 4%, respectively, for English and for Portuguese and Spanish together.
- Scielo records roughly one-third for each of these three languages.
Evidently, the source changes the search result. The graphs presented in the first study, from the new geography, would be different if the search platform were OpenAlex or Scielo. The question is: is there a way to better account for what is being produced? Or are we stuck with a supposed (imposed) golden rule that prevents us from diverging?
We already know that searching for our articles and citations in the Web of Science and Scopus influences the results. But more research is needed to better understand how the model works – and find solutions.
The third study I mentioned at the beginning of the text, on prosopography (Digiampietri et al., 2024), analyzed publications of researchers funded by the National Council for Scientific and Technological Development (CNPq) and showed that 54% and 57% of the articles by these authors registered on the Lattes platform are found in the Web of Science and Scopus, respectively. The scholars did the same for the publications of tenured researchers from the International Council for Scientific and Technical Research (Conicet) in Argentina, finding 50% of them in those two databases.
Would the articles found in these databases be less scientific?
But wait. These numbers are somewhat smoothed when analyzed according to major areas of knowledge. For Brazil, the percentages rise: 66% (agriculture), 70% (biology), and 80% (exact sciences) of articles from those researchers are found in the two databases or at least one of them.
The areas most “left out” of these databases are the social sciences and humanities: 80% of articles from Brazil’s productivity researchers and 72% of those from Argentina are not in the Web of Science or Scopus.
Not coincidentally, most of the publications in these areas are not in English. The ends come together.
What would happen with the evaluations if the databases were expanded, and today there are several, ranging from less supervised ones like Google Scholar to others with more curation, such as Dimensions, Scielo, and OpenAlex? Digiampietri et al.’s (2024) study gives a good idea of what would happen.
There’s an elephant in the room. It’s been there for a while. As long as it’s around, geographies, cartographies, and prosopographies won’t change anytime soon.
This text does not necessarily reflect the opinion of Unicamp.
[1] In this text, we will use different terms to refer to groups of countries, precisely because the three texts we are based on use different approaches. The new geography uses income ranges defined by the World Bank: high, middle, and low income; the new cartography uses terms like central countries and Global North and South; the prosopography uses peripheral centers to refer to Latin America, especially Brazil and Argentina.
[2] There’s a basic cost of $1 per DOI. Although it’s not a high fee, in large quantities, it could be a factor in lower adoption.
[3] King Charles III, when still Prince, said that the main export product of England, since the formation of its empire, has been the English language, which became universal.