![]()
A set of tools have been developed to facilitate the generalization of data sets. Generalization in ArcSDM3 refers to the 'reclassification' of evidential themes. The tools developed for ArcSDM3 all use a similar method: the user selects the evidential theme and the field containing the classes to be generalized. Using one of the generalization tools, the user interactively specifies how the current classes are to be generalized and what the new classes will be. Once specified, the new classes are store in a GEN file that is joined to the evidential theme for symbolization and use in calculations.
A new data set is not created. Instead, the new classifications are joined to the attribute table. New descriptive text labels can also be appended during the generalization process.
This submenu selection works
the same as in the previous version except in one important aspect. It is no
longer possible to add additional attributes to a VAT; so the generalization
process now creates a generalization file, also known as a GEN file. The naming
convention for the GEN file is Gen-evidential raster weight table.dbf. For
example if the kbgeol evidential raster, which uses a weights table
kbgeol-CT.dbf, then the generalization file created would be named GEN-kbgeol-CT.dbf.
The characters through the evidential raster name, “GEN-kbgeol-“, should not
be modified by the user because this is what the software uses to associate GEN
files with evidence layers. The user is free to modify the name following the
second dash as they see fit.
When the Gen table is created, it is joined to the evidential theme. ESRI has not allowed for programmatic symbolization on an attribute in a joined table. Therefore it is necessary to interactively symbolize by one of the generalization attributes.
It is necessary to understand how ArcMap manages joins. There are many ways that a joined table can be unjoined; so it is necessary to be familiar with the join tools. See the join management discussion section and the ESRI help to understand joins.
Frequently an evidential theme has been generalized to two classes, creating a binary map in which each cell is either on or off a pattern. In some cases, reducing an evidential theme to a binary pattern may not be the most appropriate way of handling the data. A geological map, for example, might be more suitably treated as a three or four class map. Any table or chart created with the two previous functions can be examined to determine the optimum way of generalizing each of your evidential themes. Useful statistical measures of a generalization, particularly when the generalization involves more than 2 classes, can be obtained by examining the weights, contrast, and confidence from the Calculate Theme Weights tool. Calculate Theme Weighs will not, however, calculate weights based on a attribute in the Gen table. See the Calculate Theme Weights section for guidance on how to calculate weights of a multiclass generalization.
In the evidential theme's attribute table, the fields added by reclassification record the reduction of classes from initial exploration up to the stage of input for calculating a response theme. And in conjunction with weights tables and charts based on them, you can see the rationale for the generalization, which may be in several stages.
| Next | Section Contents | Home |
![]()
What you need to specify in the Generalize Evidential Theme dialog box
Below is the Generalization window. This same window is used with weights of evidence and the neural networks.
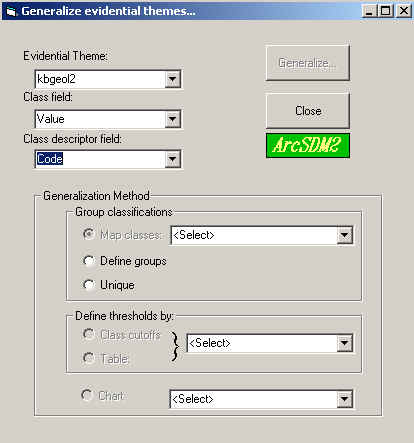
Evidential Theme – All evidential themes (integer raster layers) in the current view are displayed in the combo box. Select the evidential theme theme you want to generalize.
Class Field – Only the value attribute of the evidential theme selected above are displayed in the combo box. Select the field in the evidential theme’s attribute table that contains the classes you want to generalize.
Class Descriptor Field – Any string fields found in the attribute table of the evidential theme selected above are displayed in the combo box. If you are going to use one of the threshold selection tools (see descriptions below), the tool will try automatically to parse strings that define continuous ranges of numbers. You will edit any descriptive text that is automatically generated. Select the field containing descriptions of the classes. If there is none, select ‘<None>’. Whether you specify a class description field or not, you will be able to specify class descriptions for your new generalized classes and a name for the field to which they will be written.
Generalization Method – Select one of the following generalization methods or tools. The tools are each described in more detail below.
Group Classification: Map Classes; Define Groups, and Unique. These three tools were designed to generalize free or nominal type data. Map Classes or Unique can be used to define a generalization of unique values in the theme. Unique is primarily used when no generalization is desired, for example with the neural network tools. The Define Group tool can be used for any data to base your new classes on queries of the data attributes.
Define Thresholds by using: Class cut-offs (slider bar/text input); Chart; Table. These tools were designed to generalize continuous or ordinal data, based on cumulative ascending or descending tables.
Generalize... – Clicking the 'Generalize...' button will display the dialog specific to the generalization tool you have specified, along with any ArcView documents, that is a chart or table, to be used in the generalization.
| Next | Section Contents | Home |
![]()
Common components of the Generalization Tool dialogs:
Each of these dialogs have the following controls or elements in common:
The name of the evidential theme you are generalizing is displayed near the top of the dialog. For the reclassification tools, class field and class description field, if any, will also be displayed. Typically the class field and class description field are described as the 'current' fields.
Default names for generalization class and class descriptions fields are displayed on all dialogs. The default class field name is value2. The default generalization class description field name is S_Value2 if no no current field was specified (<None>). If a class description field is specified, which can only occur for rasters made from character fields; then the default name is <Character field name>2. Some times the default name is 'Descrip' is used in place of S_Value2. You are able to edit the default descriptor field names; but always leave the default generalization class name, value2.
Define Reclassifications:
Map Classes – allows you to explicitly map each class to a new one, as well as provide descriptive text for each label. Also has an option to make a generalization of all unique map classes. This is especially used for the neural networks where no generalization of the evidence is desired.
Define Groups – allows you to assign a group of records/classes to a new class. The group(s) of records/classes are defined by applying an attribute query.
| Next | Section Contents | Home |
![]()
Class to Class Mapping Tool for generalizing Evidential Themes with Categorical Data
To use the Class to Class Mapping Tool, select Generalize Evidential Theme from the ArcSDM3 menu. Select the Evidential Theme, the Class Field (field containing classes you want to generalize) and a Class Descriptor Field (field containing strings that describe the classes in the class field). Select the 'Map Classes' Generalization method (under 'Define Reclassifications'). Then click the 'Generalize' button. The following dialog box will be displayed. A description of each of the elements in the dialog is described below.
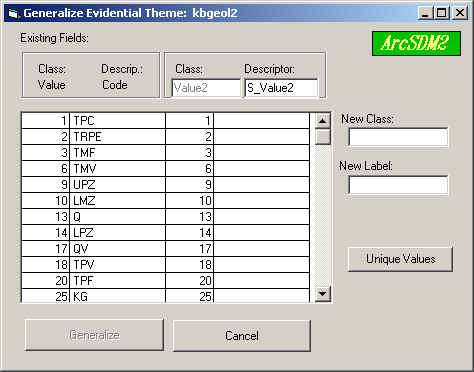
The contents of the list box display:
Column 1: the classes found in the Class field specified in the previous dialog box are listed.
Column 2: the text strings found in the Class Descriptor Field specified in the previous dialog box. If <None> was specified, this column will be blank.
Column 3: will contain the new generalized class values after you edit them. It initially contains the same values as column 1.
Column 4: is initially empty but will contain descriptive text of the new classes if you add it. ( If no text labels are added to this column, no new label field will be added to the evidential theme attribute table.)
Editing the values in the list box display to define your new classes
There are two ways to edit values in the list box:
1. a) To select the row to edit, click the left mouse button anywhere in that row to highlight the row.
b) To enter a new Class or a new Label, type the entry in the Class or Label box and press enter. The new value will appear in column 3 or 4 in the window.
To edit more than one consecutive row at once, hold down the left mouse button while selecting adjacent rows or click the left mouse button on the first row and then click the left mouse button while holding the shift key. The values entered in the edit dialog will be written to all of the selected cells. This tool can only apply to consecutive rows. If alternate rows have the same values, they must be entered individually.
2. a) Select the rows to edit
as described above. Enter the new Class or Label value in the text entry box.
b) Press Enter. The new value will appear in all the selected
rows.
Alternatively, the generalization based on unique map classes that is all classes in the raster attribute table can be made by clicking the Unique button. This will make a one to one mapping of all the classes for the generalization and activate the Apply Generalization button.
Applying the generalization
When editing is complete, click the 'Apply Generalization' button. The new fields will be added to the evidential theme's attribute table.
| Next | Section Contents | Home |
![]()
Grouping Tool for generalizing Evidential Themes with Categorical Data
To use the Grouping Tool, select Generalize Evidential Theme from the ArcSDM menu. Select the Evidential Theme, the Class Field (field containing classes you want to generalize) and a Class Descriptor Field (field containing strings that describe the classes in the class field). Select the 'Define Groups' Generalization method (under 'Define Reclassifications'). Then click the 'Generalize' button. The following dialog box will be displayed. A description of each of the elements in the dialog is described below. Click on any of the elements to jump to its description.
While using the Grouping tool, it may be helpful to view the table containing the attributes that you are using to define some or all of the groups. Once the dialog is opened, you select a Table to join and this table will be opened to be used to remember the attribute names and to facilitate query construction.
The New Class Descriptor Field is set by default to the descriptor attribute selected in the previous Generalization menu with the number 2 appended. Thus previously, code was selected as the descriptor attribute; so the New Class Descriptor is called Code2. The user can change this name by typing a new name, if desired.
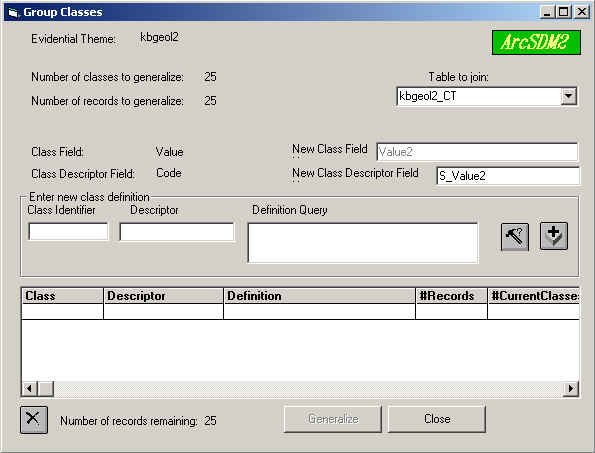
In addition to the items you selected in the previous dialog, and described previously, the following are also reported:
Number of records to generalize – This reports the number of records in the evidential theme's attribute table. You can use this as reference in conjunction with the 'Remaining number of records:' reported at the bottom of the dialog. You will only be able to apply your generalization after all of the records have been grouped.
Number of classes to generalize – This reports the number of classes contained in the class field, which will be the same or fewer than the number of records.
Associated table to join to attributes for queries – This combo-box lists any weights tables that you have calculated for an evidential theme (it looks for a field named "Class"). If you want to group your attribute records based on weights, contrast, etc., you can calculate the associated table. Once you select a table, it will be joined to the attribute table based on matching values between the "Class" field and the class field you specified previously.
Defining a generalization group
New Class Field – The New Class Field value is set to Value2 and cannot be changed by the user. ArcSDM3 assumes the new generalized value in the GEN file is always Value2.
New Descriptor Field – The New Class Descriptor Field is set by default to the descriptor attribute selected in the previous Generalization menu with the number 2 appended. Thus previously, code was selected as the descriptor attribute; so the New Class Descriptor is called Code2. The user can change this name by typing a new name, if desired.
New Class Identifier– This is the first control to enter information about a new generalization. The field only accepts integers. You cannot enter anything to this line until you have not specified a table to join.
New Descriptor – Type in a string to describe your class integer, if you want. Data in this line are not required to create a generalization.
Group
Definition and Query Builder
- The user must enter the desired query. The spelling of
the attributes can be checked by referring to the open table. Query formats are
verified by clicking the
![]() If the query is valid, the
If the query is valid, the ![]() button will turn green, as shown here. Queries such as C<=0 are acceptable.
More complex queries can be used.
button will turn green, as shown here. Queries such as C<=0 are acceptable.
More complex queries can be used.
There is no longer a need to deal with null records due to the #Points being equal to zero. When the #Points is zero, the weights and associated contrast for that record will have a value of zero. Be careful that a zero contrast is due to a #Points equal to zero, that is a null, and not a true zero.
It is possibly to select a record more than once with ill-formed queries. This situation will be shown by the number of records remaining being negative and the Generalize button will be inactive.
Once you have specified a class integer and a query to define the group of records/classes to generalize, the 'Add Generalization' button will be enabled.
Add
Generalization ![]() – Click this button to add your
group definition to the list of definitions in the display
window. This button will only turn green if the query is valid. The values you entered in the input controls will be
appended to the display of group definitions below, and they will
be cleared from the input controls. The 'Add Generalization'
button is enabled only when an integer has been specified as a
new class value and valid query has been defined to group a set
of records for generalization.
– Click this button to add your
group definition to the list of definitions in the display
window. This button will only turn green if the query is valid. The values you entered in the input controls will be
appended to the display of group definitions below, and they will
be cleared from the input controls. The 'Add Generalization'
button is enabled only when an integer has been specified as a
new class value and valid query has been defined to group a set
of records for generalization.
Generalization Display Window – Displays the generalization 'groupings' that will be applied to the evidential theme attribute table. A group definition or generalization will not be applied to an attribute table until it has been moved from the input controls to the display window.
To select one or more rows in the display, drag your mouse over the rows you want to select. Only contiguous rows can be selected at one time.
If you would like to edit one of the displayed rows, select it and click the 'Remove' button located below the display on the left side of the dialog. This will remove the generalization from the display window and display its components in their respective input boxes. You can edit any of the parts and re-add it to the display.
The Class, Description, and Definition that you specified before are written to a new row in the generalization display window. In addition, the number of records and the number of current classes selected by the query are displayed:
#Records – The number of records in the evidential theme attribute table that are selected when the query string/group definition is applied. When the generalization is added to the display, this number is subtracted from the number of records remaining to be processed that is reported at the bottom of the dialog.
#CurrentClasses – The number of unique classes contained in the class field that are represented by the records selected by the specified query.
Remove
Generalization ![]() – The 'Remove generalization' button is
enabled when one or more of the rows in the generalization
display window are selected. Clicking the button removes the
selected rows from the display. The last row only will be
displayed in the input controls, so if you are removing rows to
edit them, remove them one at a time, edit them and re-add before
removing the next.
– The 'Remove generalization' button is
enabled when one or more of the rows in the generalization
display window are selected. Clicking the button removes the
selected rows from the display. The last row only will be
displayed in the input controls, so if you are removing rows to
edit them, remove them one at a time, edit them and re-add before
removing the next.
Reporting the Number of records remaining – The initial 'Number of records remaining:' is the total number of records in the evidential theme attribute table. As you define queries to select groups of records for assignment to a new generalized class, and add them to the display window, the number of records is subtracted from the number of records remaining. When all of the records in the attribute table have been assigned to a group, the number of records remaining will be zero and the 'Generalize' button will be enabled. It is possibly to select a record more than once with ill-formed queries. This situation will be shown by the number of records remaining being negative and the Generalize button will be inactive.
Generalize – Applies the generalization as defined by the new classes, new class descriptors and queries of existing classes to the attribute table. Each row in the generalization display window is processed in sequence: the query is applied to the attribute table and the specified class and class descriptor are written to new fields for the records selected by the query. The selection is removed and the next query is applied, until all of the rows have been processed. The Generalize button will only be active if the Number of records remaining is zero.
Close – Clicking the close button closes the dialog, unjoins any tables joined to the evidential theme attribute table, and joins the new GEN table to the evidence theme. The user can then symbolize the evidence based on this generalization..
| Next | Section Contents | Home |
![]()
Unique Tool for generalizing Evidential Themes with Categorical Data
Unique can be used to define a generalization of unique values in the theme. Unique is primarily used when no generalization is desired, for example with the neural network tools or with weights of evidence without generalizing the evidence. This function is needed to create a GEN table, which is required for Calculate Response or Generate neural network inputs.
| Next | Section Contents | Home |
![]()
Define Thresholds:
Common components
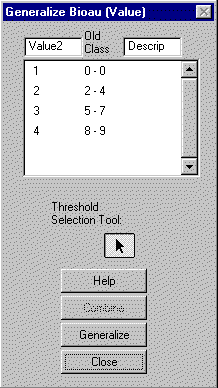
Three variations of a thresholding tool have been developed. Because these tools are so similar, the following description applies to all three. The differences among the three are described briefly following this section.
The threshold select tools are designed to define the breakpoints or thresholds between groups of existing classes in continuous or ordered data. When you select thresholds you are defining the upper limit of a classification. For example, if you have a data set with values that range from 1 - 10 and you specify two thresholds, 4 and 7, the following class grouping will result: 1 - 4; 5 - 7; and 8 - 10. If you assigned these grouping to new classes identified by 1, 2 and 3 respectively your attribute table might look like the following when the generalization is complete. This approach causes a problem with some of the tools if you are using a cumulative ascending weights table. The break point needs to be selected at one class higher, not at the value of maximum contrast.
|
 |
Default names for the new fields are provided the same way that they are in the other generalization tools. You can edit them by clicking on the text line they are displayed in and typing a more suitable name.
The display window – The display window works the same way for all three threshold selection tools. When the dialog box is first displayed, the window will contain one row with the following elements:
Column 1: By default '1' will be displayed. Unedited, this will be the new class value.
Column 2: The initial class is the entire range of values found in the class field you specified.
Column 3: This column will be blank initially.
The threshold selection tool – This tool is a application arrow for the generalization tools that interacts with highlighted rows in the table; and thus let you interactively apply the selected thresholds in a table and a slider bar/text input line combination in the Class-Cutoff tool dialog. How these tools are used is described in the section that follows. In the case of a cumulative-descending weights analysis, you apply the selection by first highlighting the rows in the table where you want to make breaks. A row is highlighted by clicking on the left end of the row. Then clicking the Selection Tool after all of the desired breaks are defined. In the case of a cumulative-ascending weights analysis table, you must highlight one row higher to get the break at the desired location.
Combining groups (or deleting a classification) – If you have defined a class and would like to remove it, you need to add it to the class above or below it. Select one or more 'adjacent' classes by clicking on one of the rows in the display window and dragging the mouse across all of the rows you want to include. The selected rows will be highlighted. When one or more rows are selected, the button labeled 'Combine' will become enabled. To combine the selected rows into a single class, click this button.
Editing the Class and Class Descriptor Values – The threshold selection tools automatically provide default classes, and class descriptors if an existing class description field was specified. You can edit values in either of these columns in the following way:
Select the row whose values you want to edit by clicking on it.
Type a new class in the text input line labeled 'Edit <New Class Field Name>:'. Press Enter to apply the change to the value in the display window. If you try to change the class value to the number you have specified as defining areas of missing data (during the setting of your analysis parameters) you will be asked whether you intend to assign this class the missing data value.
Type a new class descriptor in the text input line labeled 'Edit <New Class Descriptor Field>:'. Press Enter to apply the change to the value in the display window.
Apply Generalization – When you have finished defining the generalization, click the button labeled 'Generalize' to apply it to you evidential theme attribute table.
| Next | Section Contents | Home |
![]()
Threshold Selection using the Class-Cutoff tool
How to specify a threshold using the slider bar
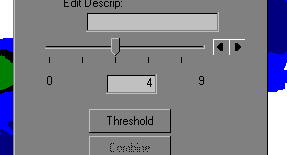
When the dialog is opened, the value at the left and right ends of the slider bar indicate the minimum and maximum values respectively of the range of classes.
There are three ways that you can specify the threshold using the slider bar on the Class Cut-off dialog box, pictured above:
In all three cases, the value that is displayed in the text input line is the threshold value. (When you type a value in this line, the slider bar does not respond properly. The marker will move, but not to the correct position. This is a limitation of the Dialog Designer's slider control.)
When the correct threshold is displayed, click the button labeled 'Threshold'. This applies the threshold to the range of classes and displays the new class ranges in the display window. The slider bar is now disabled until one of the rows in the display is selected. When you select a row in the display, the minimum and maximum of the class range are updated and the slider bar is enabled again. Repeat the selection procedure until you have arrived at the classes you want to apply.
If you desire to make several breaks for a multi-class generalization, this tool will do that correctly if you start with the highest breakpoint and work down.
Removal of a classification from the generalization, and editing of class and descriptor values are discussed under the previous general thresholding discussion.
| Next | Section Contents | Home |
![]()
Selecting Thresholds using a Chart document
In ArcMap, this generalization simply uses the chart as a simple guide to display the data and assist in defining the break points.
To select thresholds using a chart:
How to select thresholds using a chart
The chart document you selected will be displayed along with the associated table. If the wrong chart displayed, ensure that your chart has a unique name so that ArcMap can differentiate between documents. The threshold generalization tool will be displayed in the upper right corner of your screen. Inspect the chart to define the breaks and highlight the rows in the table where the desired breaks occur by clicking on the left side of the row.
Please see the Common Components section for a description of the controls that the threshold selection dialogs have in common.
After highlighting the desired breaks in the
table, activate the Threshold Selection Tool 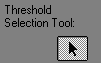 on the dialog
by clicking on it. You can change the selection by simply changing which
combinations of rows are highlighted.
on the dialog
by clicking on it. You can change the selection by simply changing which
combinations of rows are highlighted.
As you select points on the chart by highlighting the row in the table, the class definitions or ranges in the dialog display window will be updated.
| Next | Section Contents | Home |
![]()
Selecting Thresholds using a Table document
To select thresholds using a table:
How to select thresholds using a table
Selection of thresholds from a table document is very similar to selection using a chart.
When you click 'Generalize', the table document you selected will be displayed with the same threshold selection dialog placed in the upper right corner of the display.
To select a threshold: Highlight the rows in the table where break points are desired. The breaks are always picked from the highest class to the lowest. If you are working on a cumulative-descending table this will select the appropriate break points. If you working, however, with a cumulative-ascending table, it is necessary to put the break points one class higher. Thus in a cumulative-ascending table with classes 1-14 with the maximum contrast in class 8, you should highlight class 9, the next higher class. Then the generalized class intervals will be 1-8 and 9-14. For a cumulative-descending table, if you highlight class 9, it will get generalization class intervals of 1-8, 9-14. This is because the generalization starts with class 14 and the interval continues to the first break.
Activate the Threshold Selection Tool on the dialog by clicking on it.
You may encounter problems because the table document is not scaled to fit in ArcMap's display window the way a chart document is. For example, if you are selecting your thresholds based on the Contrast values they may be hidden under the dialog, or off the screen. A few ways to alleviate this problem are:
| Next | Section Contents | Home |
![]()