References
Methods
ArcSDM3 provides tools for performing four methods of quantitative mineral potential mapping or spatial modeling in ArcMap and Spatial Analyst. This section provides description of each method as well as key terms used in the implementation of these methods. (Please refer to the Glossary for additional definition of terms used in ArcSDM3.)
Key Terms ![]()
References ![]()
![]()
Key Terms
Exploration data set. Here we refer to digital data sets, such as digitized geological maps, geophysical images, geochemical survey data and remotely sensed images, frequently employed by exploration geologists in the mineral exploration process. There is always a process of extracting evidence from the raw data set to be used in prediction. This process depends strongly on the exploration model being used.
Exploration model. There are a large number of deposit models that have been defined for the various mineral deposit types, based on deposit characteristics. Deposit models help to classify and identify new occurrences, lead to an improved understanding of how the deposits formed, and act as an aid to exploration. However, they are usually based on characteristics of the deposit and its immediate surroundings, and many of the characteristic diagnostics of a mineral deposit type cannot be used with regional exploration data sets. The exploration model, on the other hand, refers to the characteristics of a deposit type identifiable in regional data sets, as used in the exploration process. It is important to note that the absence of evidence can be equally important as the presence of evidence and data on negative associations between deposit and particular types of data are often poorly documented.
Evidential Theme. This is a map or area layer (in either vector or raster format) used for prediction of point objects (mineral occurrences). The polygons or grid cells of the evidential themes have two or more values (class values). For example, a geological map may have two or more values representing the classes (map units) present. Weights of evidence and logistic regression were originally defined for binary evidential themes (also named binary patterns in several publications) but they can also be applied to themes with more than two classes. Usually for these two methods multi-class evidential themes will be generalized, or simplified, by combining classes to a small number of values, facilitating interpretation. Evidential themes used for neural network analysis, however, should retain their detail, allowing the neural network algorithms as much information as possible to classify the data. For fuzzy logic, the classes in each evidential theme are assigned a fuzzy membership in the range [0,1]. The degree of generalization of the theme in this process is based on the user's expert opinion. In multivariate statistical terminology, an evidential theme is the same as an 'explanatory' variable.
Data Type of Evidential Themes. For weights of evidence and logistic regression, the user is asked to specify whether an evidential theme contains 'ordered' or 'free' data. 'Ordered' describes data that use an ordered measurement scale while 'free' describes data that have a categorical or nominal measurement scale. Weights of evidence will allow the calculation of cumulative weights tables for ordered data sets only. The logistic regression method requires that multi-class 'free' data sets, for example, a geology map with more than two rock type classifications, be expanded to a series of binary maps. This expansion is carried out automatically in ArcSDM3.
Training points. A point layer consisting of the locations at which the point objects are known to be either present. Weights of evidence (normal option) and logistic regression require a training point theme defining known point occurrences. In mineral exploration, the points are the mineral deposits (showings, occurrences, etc.) previously discovered by prospectors, mappers and exploration companies. But in other studies, the point objects may consist of locations of seismic events, intersections of faults, locations of springs, and other point types. The neural network RBFLN (supervised) method requires training point themes defining both presence and absence of the point objects. The terminology in ArcSDM3 has been kept as generic as possible; however, the theme indicating the presence of point objects is referred to as a 'deposit training point theme', and a theme indicating absence is referred to as a 'non-deposit training point theme'. Databases of locations where mineral deposits are definitely not present are not often kept by exploration geologists so ArcSDM3 includes a utility to generate a set of points at locations of low probability. See 'Generate Random Points...'. Expert weights of evidence, the fuzzy clustering - unsupervised supervised option, and fuzzy logic do not use training points.
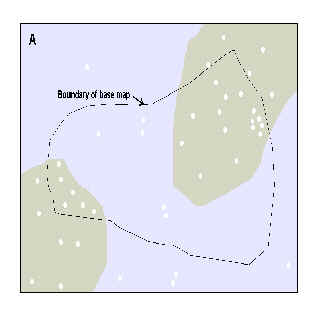
Study area theme. In ArcSDM3, the study area is an integer grid theme that defines the region of interest. It acts as a mask on areas of evidential themes and, if they are being used, training points outside the study area are ignored during processing. The study area theme is used by all 4 ArcSDM3 methods. It is sometimes referred to as the 'base map'.
 |
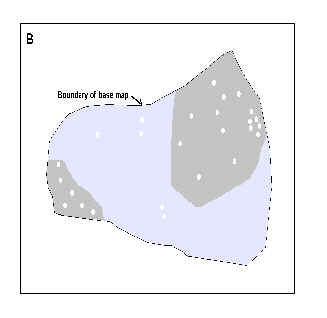 |
| Figure1. A. Rectangular area showing binary evidential theme and training points. | B. Same area trimmed back to study area base map, excluding both points and areas outside study area. |
Missing Data Integer. An integer is required to define areas of missing data for each evidential theme. Each method handles missing data differently (refer to the sections that follow, describing each method). The missing data integer is required even if missing data is defined by 'No Data' or the evidential theme does not contain any missing data within the study area. Missing data is different from the concept of 'No Data'. (See What is the difference between 'Missing Data' and 'No Data'.)
Unit cell area. In weights of evidence and logistic regression, each training point is assumed to occupy a small unit area, named the unit cell. In order to calculate the probability of a point occurrence, a unit of area must be selected. The output from weights of evidence and logistic regression is a map showing the probability that a unit area contains a point. Thus the values of probability will change with the choice of unit cell area. The unit cell is a constant set at the beginning of a particular computer run, and is the same for all training point and evidential themes. The area of the unit cell is unrelated to physical size or influence of points, and is independent of the grid cell size used in raster data sets. The values of the weights in weights of evidence are relatively independent of unit cell area, if the unit area is small. Fuzzy logic and neural network methods do not use a unit cell.
Unique Conditions Grid/Table. An important concept used in the ArcSDM3 implementation of weights of evidence, logistic regression and neural network analysis is the idea of a "unique conditions" table and associated "unique conditions" map. This step is carried out in grid format in Spatial Analyst, regardless of whether the evidential themes were input as vector or raster, but the concept applies equally in vector mode. The unique conditions table and map are produced by an overlay of the evidential themes selected for prediction.
A unique condition is the collection of polygons or grid cells in which the same combination of the evidential themes occurs in the overlay map. Each row of the unique conditions table corresponds to a unique set of class values, with the same characteristics as indicated by the row vector of class values, one column for each evidential theme. If the evidential themes are all binary, then the maximum number of unique conditions equals 2n, where n is the number of themes. However, the number of unique conditions rises sharply if some of the evidential themes are multi-class. The following table illustrates the concept for a combination of 3 binary themes, producing a map with 8 unique conditions.
Table 3. Unique condition table for three binary themes, in which class values are 2=present, 1=absent.
| UC Number | Area, km2 | Theme 1 | Theme 2 | Theme 3 |
| 1 | 101.7 | 2 | 2 | 2 |
| 2 | 56.2 | 2 | 2 | 1 |
| 3 | 142.1 | 2 | 1 | 1 |
| 4 | 17.0 | 1 | 2 | 2 |
| 5 | 29.8 | 1 | 1 | 2 |
| 6 | 229.3 | 1 | 2 | 1 |
| 7 | 171.2 | 2 | 1 | 2 |
| 8 | 3.8 | 1 | 1 | 1 |
In the corresponding unique conditions map, the values are the unique conditions number. The unique conditions grid is the basis of the response theme.
Response theme. This is an output map that expresses the probability that a unit area contains a point, estimated by combining the weights of the explanatory variables (evidential themes). The response map is usually classified into a small number of values and depicted as relative favourability. If the training points are mineral deposits of a particular type, then the response map show an estimate of mineral potential (also know as mineral prospectivity or mineral favourability).
![]()
Quantitative Mineral Potential Mapping in GIS
Although this computer package has been designed specifically for mineral potential mapping, it can also be used for other types of spatial prediction in which the goal is to predict the probability of occurrence of point objects. The remarks in this section are in the language of mineral exploration, but the same general principles guide other applications.
The GIS-based mineral potential mapping process can be broken down into four main steps: (1) building a spatial digital database, (2) extracting predictive evidence for a particular deposit type, based on an exploration model, (3) exploring each evidential theme individually in order to generalize or classify it, (4) combining the evidential themes to predict mineral potential.
This computer package assumes that step 1 has already been completed. This may have been carried out in totally different GIS or image processing environments, not necessarily ARC/INFO or ArcMap. Step 2 may have at least partially been done prior to doing any processing using ArcSDM3. However, parts of step 2 and all of step 3 are done within ArcSDM3 and its associated modules, and comprise in many ways the most useful part of a mineral potential study. This is because the examination of the evidential themes, particularly the spatial relationships between the training point and evidential themes, is exploratory, yielding measurements of spatial associations that are often unexpected. The process of generalization, grouping classes of evidential themes together, identifying breaks in continuous variables that maximize spatial associations, or determining the fuzzy membership of classes often leads to a better understanding of the data. Finally, in step 4, combining the evidential themes by one or more methods is valuable for identifying areas for exploration follow-up. The four methods provided in ArcSDM3 provide a variety of measures that facilitate the interpretation of results.
![]()
Copies of the following papers have been provided in order to provide a background to each of the methods included in ArcSDM3. The full references for these papers is included in the list of references appearing at the end of this section.
Method:
Weights of Evidence
Weights of evidence modelling: a
new approach to mapping mineral potential
G.F. Bonham-Carter, F.P. Agterberg and D.F. Wright
WofE1.pdf
Statistical Pattern Integeration
for Mineral Exploration
F.P. Agterberg, G.F. Bonham-Carter and D.F. Wright
WofE2.pdf
Integration of Geological Datasets
for Gold Exploration in Nova Scotia
G.F. Bonham-Carter, F.P. Agterberg and D.F. Wright
wofe3.pdf
Conditional Independence Test for Weights of
Evidence
F.P. Agterberg and Q. Cheng
CI_Agterberg.pdf
Weights of Evidence and Logistic Regression
Weights of Evidence Modeling and
Weighted Logistic Regression for Mineral Potential Mapping
F.P. Agterberg, G.F. Bonham-Carter, Q. Cheng and D.F. Wright
wlr.pdf
Logistic Regression
Fuzzy Logic
Fuzzy Logic Method
pp. 291-302, Geographic Information Systems for Geoscientists:
Modelling with GIS
Graeme Bonham-Carter
fl1.pdf
Application of fuzzy set theory
for integeration of geological, geophysical and remote sensing
data
P. An, W. Moon and A. Rencz
fl2.pdf
Neural Network Analysis
Lecture notes from neural network
session during the ArcSDM training workshop, October 29, 1999,
held at the Geological Survey of Canada.
Carl Looney
neuralnet.htm
References
References for which a copy of the text is included are identified with an asterisk.
*Agterberg, F.P., Bonham-Carter, G.F., Cheng, Q. and Wright, D.F., 1993, Weights of Evidence Modeling and Weighted Logistic Regression for Mineral Potential Mapping: In Computers in Geology -- 25 Years of Progress, Editors: Davis, J.C. and Herzfeld, U.C., Oxford University Press, New York, p. 13-32.
*Agterberg, F.P., Bonham-Carter, G.F., and Wright, D.F., 1990, Statistical Pattern Integration for Mineral Exploration: In Computer Applications in Resource Estimation: Prediction and Assessment for Metals and Petroleum, Editors: Gaal, G. and Merriam, D.F., Pergamon Press, Toronto, p. 1-21.
*Agterberg, F.P., and Cheng, Q., 2002, Conditional Independence Test for Weights-of-Evidence Modeling: Natural Resources Research, v.11, no. 4., p. 249-255.
*An, P., Moon, W.M., and Rencz, A., 1991, Application of fuzzy set theory for integration of geological, geophysical and remote sensing data; Canadian Journal of Exploration Geophysics, v. 27, p. 1-11.
*Bonham-Carter, Graeme F., 1994, Geographic Information Systems for Geoscientists: Modelling with GIS, Pergamon Press, Tarrytown, N.Y., 398p.
*Bonham-Carter, G.F., Agterberg, F.P. and Wright, D.F., 1988, Integration of geological datasets for gold exploration in Nova Scotia: In Photogrammetric Engineering and Remote Sensing, v. 54(11), p. 1585-1592.
*Bonham-Carter, G.F., Agterberg, F.P. and Wright, D.F., 1989, Weights of evidence modelling: a new approach to mapping mineral potential: In Statistical Applications in the Earth Sciences, Editors: Agterberg, F.P. and Bonham-Carter, G.F., Geological Survey of Canada Paper 89-9, p. 171-183.
Burrough, P.A., R. McDonnell. Principles of GIS. Oxford University Press, Oxford, 336p. (Contains a chapter on fuzzy logic.)
Griffiths, C.M., 1987, An example of the use of fuzzy-set based pattern recognition approach to the problem of strata recognition from drilling response: In Handbook of Geophysical Exploration, Section I: Seismic Prospecting, Volume 20: Pattern Recognition and Image Processing, Editor: Aminzadeh, F., Geophysical Press, London-Amsterdam, p. 504-538.
Hesmer, D.W., Lemeshaw, S. 1989, Applied Logistic Regression. Wiley, New York, 307p.
Looney, C.G., 1997, Pattern recognition using neural networks: theory and algorithms for engineers and scientists, Oxford University Press, New York, 458p.
Menard, S., 1995, Applied Logisitc Regression Analysis: In Quantitative Applications in the Social Sciences, No. 106, Sage Publications, London, 98p.
Zimmermann, H.J., 1985, Fuzzy Set Theory - and Its Applications, Kluwer-Nijhoff Publishing, Boston-Dordrecht-Lancaster, 363 p.
Zimmermann, H.J. and Zysno, P., 1980, Latent connectives in human decision making: In Fuzzy Sets and Systems, v. 4, p. 37-51.
| Next | Section Contents | Home |
![]()